“How healthy is my revenue cycle?”: 3 methods AI RCM companies and healthcare providers can use to measure RCM performance and show ROI
“How healthy is my revenue cycle?”: 3 methods AI RCM companies and healthcare providers can use to measure RCM performance and show ROI
Healthcare providers face rising costs and mounting complexity in revenue cycle management (RCM). Artificial intelligence (AI) can transform these operations, but proving value starts with the right benchmarks. Here are three critical RCM metrics every provider should track to measure performance and demonstrate ROI.
AI RCM initiatives need a solid performance baseline to show ROI
One of the most significant impacts of artificial intelligence (AI) in US healthcare will be in revenue cycle management (RCM) operations.
These administrative processes are estimated to cost between 2 and 7 percent of overall healthcare spending and contribute to the significant complexity of the US healthcare system. The market for RCM is, surprisingly, significantly larger than obesity drugs, whose cost has often been highlighted. Despite the high spending, few healthcare providers believe these processes are fully optimized. Patients and providers often observe errors that distract or even detract from clinical care.
Energy for improvement, especially leveraging AI, is high with significant investment flowing in this direction.
Alongside our white paper on how to build a business case and quantify this impact, The financial case for an AI workforce in providers’ revenue cycle operations, we know many organizations are looking for support in setting a baseline and truly understanding their starting point. This involves analyzing key metrics that track RCM performance. However, these metrics have trade-offs, can be prone to error, and are often inconsistently defined.
An in-depth understanding of what these metrics can and cannot show is critical for demonstrating the value of any new technology or process. The three primary metrics—net collection ratio, cost to collect, and days in accounts receivable (days in AR)—are all important. The net collection ratio primarily measures your team's effectiveness, while the cost to collect measures their efficiency. Days in AR can quickly identify process issues and enable root cause analysis.
Any organization can improve performance by dedicating more resources, but since resources are limited, AI aims to improve both effectiveness and efficiency. These 3 measures are key to understand in demonstrating ROI.

Measuring revenue cycle performance: comparing net collection ratio, cost to collect, and days in AR with their benefits and trade-offs in healthcare RCM.
Net collection ratio is a targeted measure for tracking ROI but it’s complicated to calculate and lags
What is net collection ratio and why does it matter for AI for RCM?
In simple terms, the net collection ratio measures how much of the revenue you were supposed to collect was actually collected, with the ideal maximum being 100%. This is analogous to the broader concept of revenue yield. For instance, if you were meant to collect $1,000 for a procedure but have only collected $950, your net collection ratio is 95%.

Example of net collection ratio in healthcare billing: $1,000 billed vs $950 collected (95%), highlighting 5% missing revenue.
Whether 95% is a good result depends on the context, as this metric is time-dependent. A 95% ratio for a procedure from two weeks ago, where the patient hasn't even received a bill yet, is not a problem. However, the same ratio for a claim from eight months ago, with multiple patient billing attempts already made, indicates a significant issue and risk of losing that money permanently.
It's important to note that few organizations can realistically achieve a 100% net collection ratio. A primary reason is bad debt, including unpaid bills from patients left with a balance after insurance payments. Many patients lack the financial means to pay large medical bills, and these balances are frequently written off. Another major contributing factor is insurance denials that are never successfully overturned on appeal.
What are the challenges with using net collection ratio for calculating ROI from AI for RCM?
Determining expected revenue: Accurately knowing the exact amount you are supposed to collect is not a simple task. While it can sometimes be as straightforward as looking up a code on a price list, the complexity of mapping services to contract provisions can be overwhelming. As a result, many organizations simply estimate expected revenue or accept the payer's word for it, only attempting to collect the balance after contractual adjustments. This practice can allow payers to get away with underpayments or even zero payments on some codes that are “100% adjusted off”.
Selective exclusions: Nearly all organizations exclude certain claims from the calculation, which can distort the metric. For example, some services, like extra payment for robotic surgery, are billed even when they are not expected to be paid. Excluding these from the calculation is reasonable. However, judgment calls are required for other denials. An "avoidable write-off" might be included in the calculation, while an "unavoidable write-off" might be excluded, and these distinctions vary between organizations. This practice can artificially inflate the metric when too many claims are excluded as “unavoidable”. Additionally, some organizations only calculate the net collection ratio on "closed" claims, leaving complex, denied, and appealed claims out of the ratio entirely.
Clawbacks: The ratio can also decrease over time. Payers can and do "claw back" revenue from prior claims that they later determine were overpaid or inappropriately paid. These recoupments can occur months or even years after the initial payment.
Time lag: The net collection ratio has a considerable lag, meaning that trends may not become apparent for months. This can make it feel less urgent than other metrics.
Narrow scope: The metric is a narrow measure of RCM performance, not a complete indicator of the practice's overall financial health. A service line with a 100% collection rate could still be unprofitable if it has shrinking volume and is overstaffed. It also risks encouraging teams to overinvest in pursuing the "last 1 percent" of collections, which often yields diminishing returns.
Best practices for using net collection ratio for demonstrating ROI from AI for RCM
Be transparent: Clearly define what is included and excluded from the calculation and relate it to the overall scope of activity.
Contextualize: Always assess the ratio in the context of how much time has passed since the service was rendered.
Be pragmatic: Be realistic about estimating expected revenue and prioritize consistent updates over a massive one-time effort.
Set realistic goals: Don't set a 100% goal if it's not practical. Determine where the line of diminishing returns is for your organization.
Use metrics in concert: Use the net collection ratio in conjunction with other metrics that speak to the organization's broader financial health.
Cost to collect helpfully links RCM performance with efficiency but root causes are hard to pinpoint
What is cost to collect and why does it matter for AI for RCM?
Cost to collect is the amount of money an organization spends on billing for every dollar of revenue it brings in. For example, if you collected $1,000 and the total associated cost was $30, your cost to collect is 3.0%. This metric balances the resources put into operations with the output, making it an excellent measure of efficiency. If a team can do more work and bring in more money with the same resources, the cost to collect will decrease.
The calculation of this metric is highly dependent on which costs are included. While labor costs are a significant and generally easy-to-calculate component, other complexities exist:
Hidden labor costs: Many employees have RCM responsibilities that aren't explicitly part of their job description, such as a medical records specialist pulling charts for billing audits or a physician assistant conducting peer-to-peer prior authorizations. These costs must be accounted for.
Technology and vendor costs: Accurately allocating technology and vendor costs specifically for billing versus other operations can be difficult.

Cost to collect formula: total RCM costs such as wages, technology, vendors, and audits divided by total payments collected.
What are the challenges with using cost to collect for calculating ROI from AI for RCM?
Lagging indicator: The work you do today may not result in payment for one to three months, making real-time comparisons challenging. However, it can be useful for tracking long-term trends.
Difficulty drilling down: It can be hard to drill down into specific drivers of the cost to collect unless you have robust systems for tracking and aligning responsibilities with specific tasks, payers, or service lines.
Data orchestration: The data needed to calculate this metric often requires significant involvement from the finance department, as it includes things like employee benefits, rent, and outsourced IT expenses, which may not be readily available to the RCM team.
Best practices for using cost to collect for demonstrating ROI from AI for RCM
Be clear: Be transparent about what costs are included in the calculation.
Prioritize consistency: It's more important to have consistent, regular updates than to achieve a perfect one-time calculation.
Track long-term trends: Use consistent definitions and track the metric over long periods (e.g., quarters rather than weeks).
Use with activity metrics: Report the cost to collect in the context of activity metrics—such as claims dropped per week, number of FTEs, or average time per phone call—which can show efficiency gains on a shorter time horizon.
Days in accounts receivable (Days in AR) is a leading indicator but it’s noisy and can incentivize write-offs
What is days in AR and why does it matter for AI for RCM?
In simple terms, Days in accounts receivable (Days in AR) measures the average number of days it takes to collect payments due. This is related to the broader concept of Days of Sales Outstanding. A common misunderstanding is that Days in AR is the same as "how long it takes to get paid," though the two are related.
What are the challenges with using cost to collect for calculating ROI from AI for RCM?
Days in AR often have an inverse relationship with the net collection ratio. Some teams may hold onto claims to maximize net collections, which can increase Days in AR, while others might write off claims more quickly to keep AR manageable, potentially lowering Days in AR but hurting the net collection ratio. This trade-off makes it difficult to compare Days in AR across different organizations, as the metric is highly dependent on an organization's strategy.
A key advantage of Days in AR is that it provides a more immediate indication of issues than other metrics. Problems will show up in a matter of days or weeks. However, the metric can also be affected by external factors, such as changes in volume or payer mix, which can introduce noise.
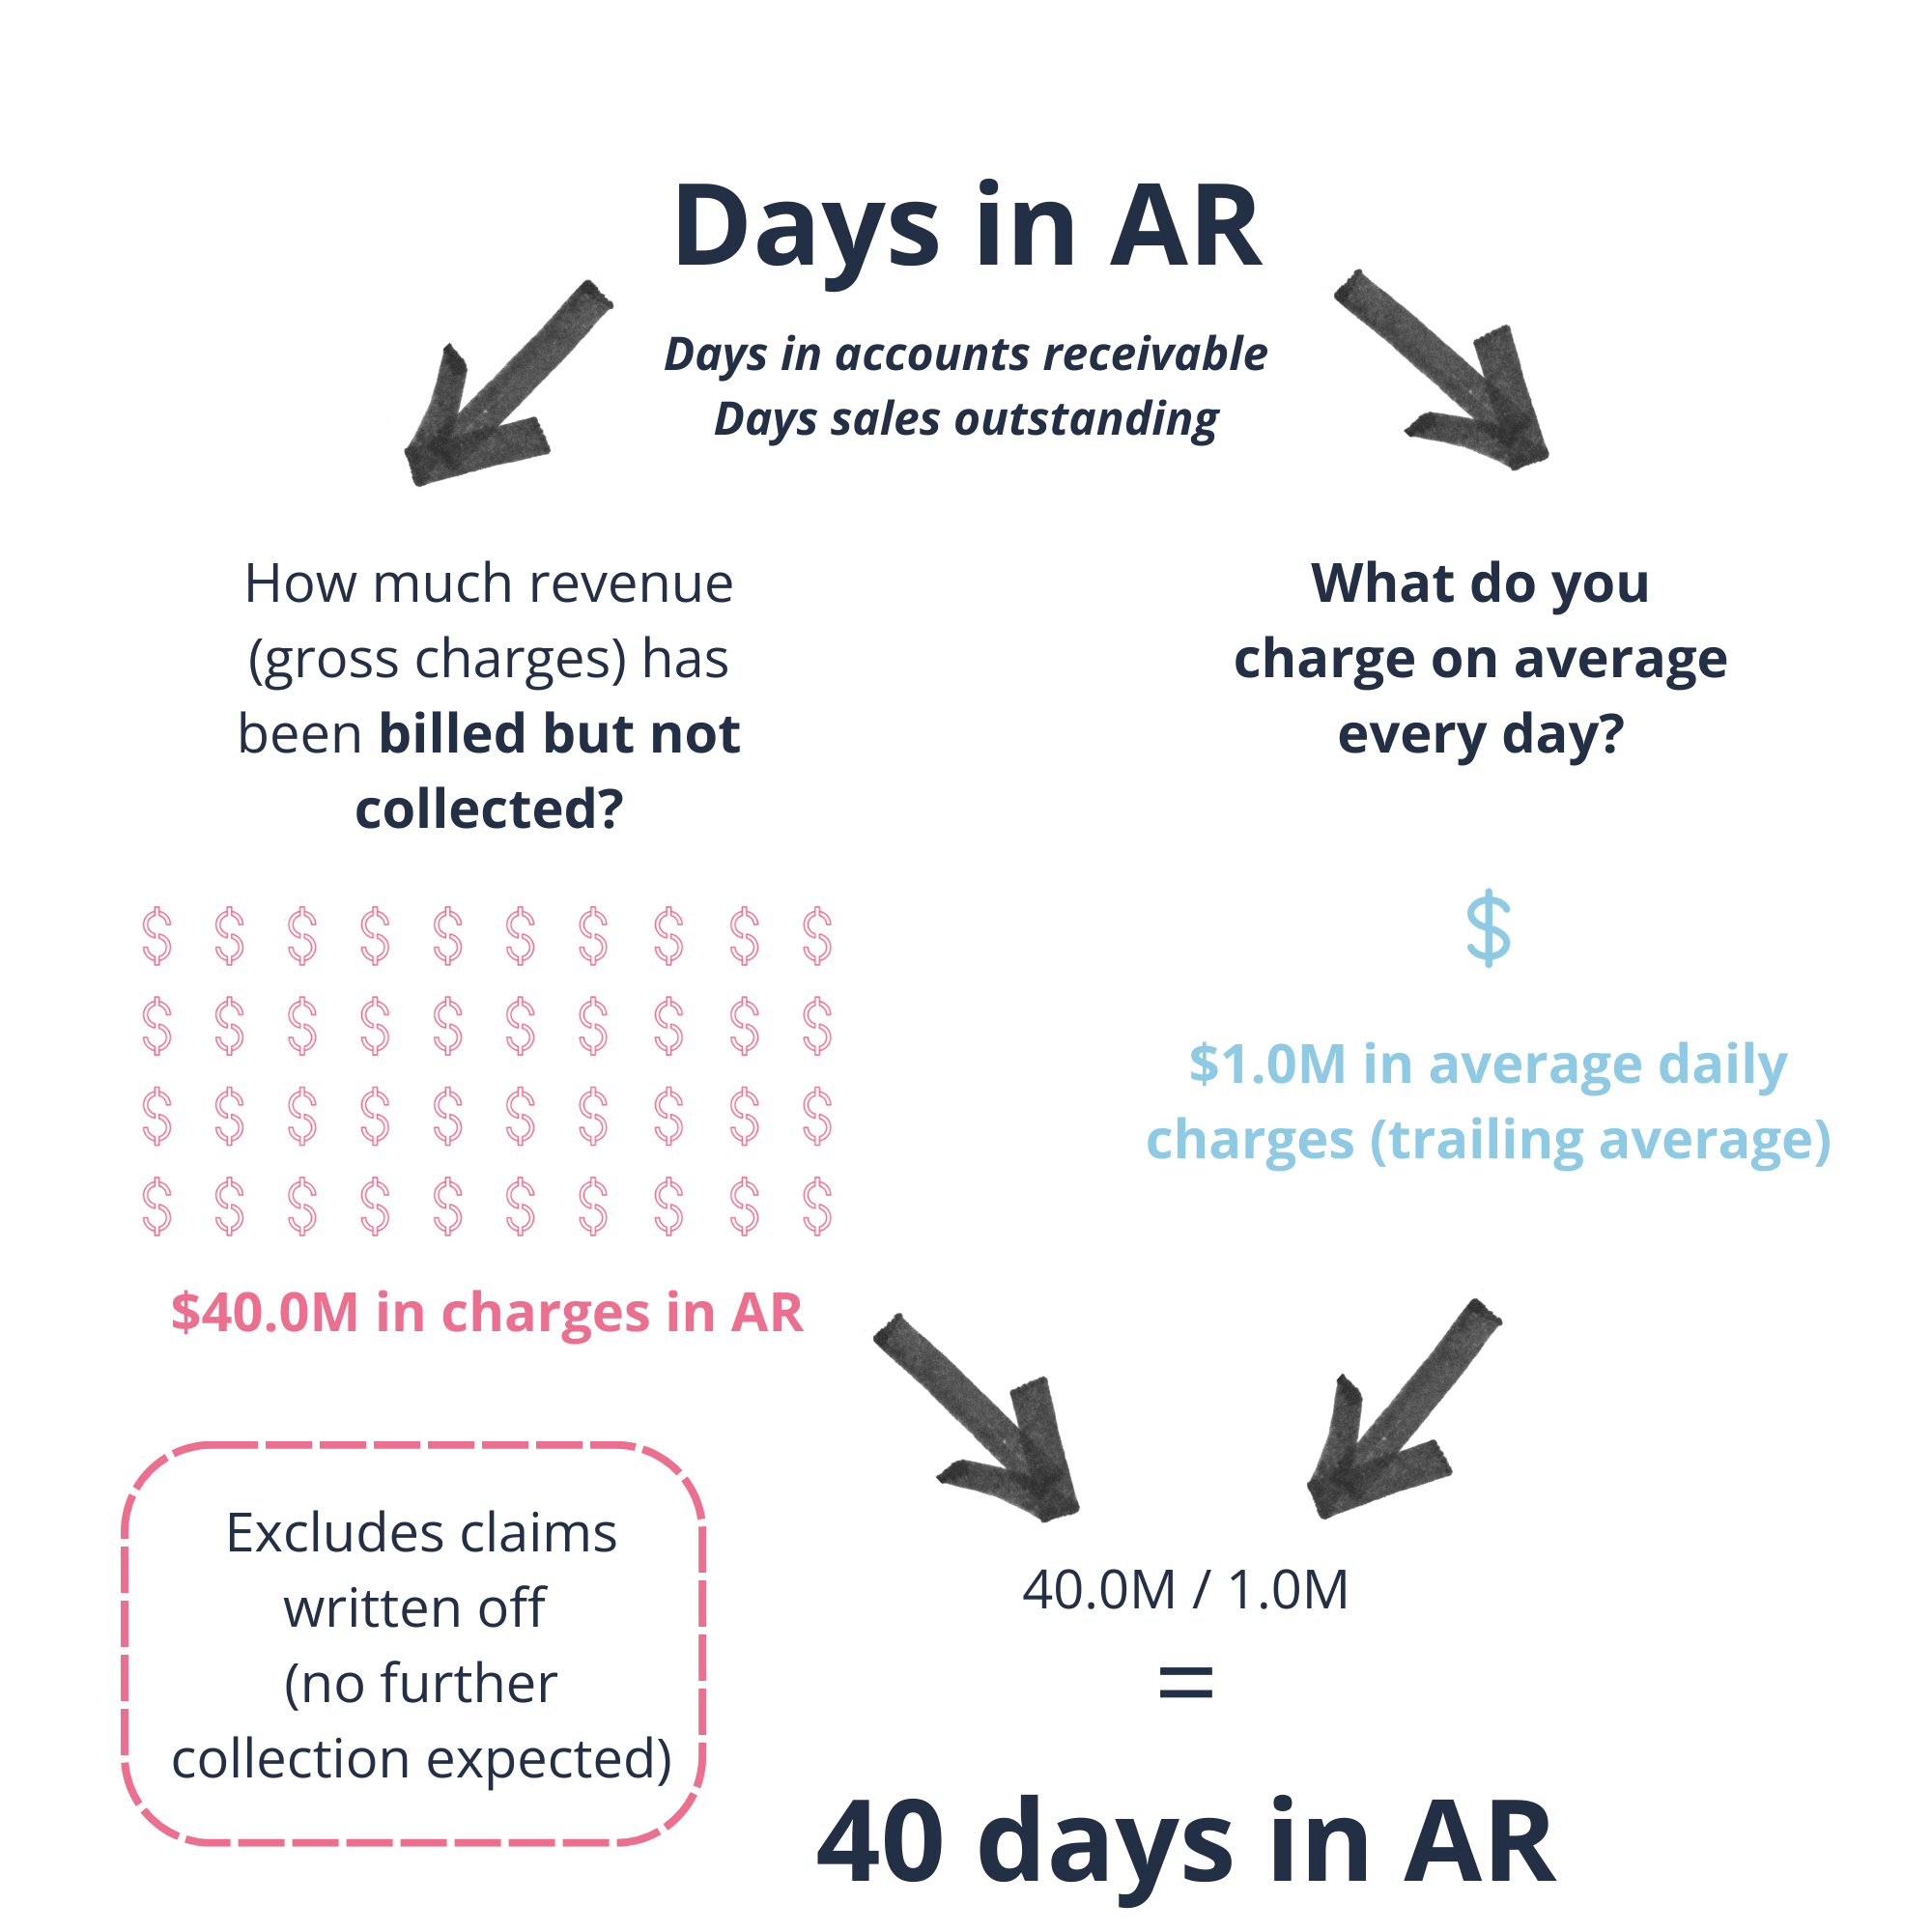
Days in accounts receivable (Days in AR) example: $40M billed but not collected divided by $1M daily charges = 40 days in AR.
Best practices for using days in AR to demonstrate ROI from AI for RCM
As a trending indicator: Use this metric as a daily or weekly indicator of the state of your accounts receivable.
Break down the data: Break down the metric by relevant claim attributes, such as service line, payer, facility, or procedure type.
Provide context: Use the metric in conjunction with other financial indicators and, where possible, contextualize it for changes in sales volume.
Prove the ROI of AI in your revenue cycle
Download our white paper, The Financial Case for an AI Workforce in Providers’ Revenue Cycle Operations, supported by Outbound AI. This paper shows how AI workforce solutions can drive margin improvements of 85–500 basis points by reducing cost to collect, cutting revenue leakage, and accelerating cash flow. It also provides a framework to help healthcare leaders size opportunities and build business cases for AI initiatives.
Want to explore how these insights apply to your organization and leverage Prova Health’s expertise? Email our US Senior Director, Ryan Callahan, at ryan.callahan@provahealth.com.